
Ferro Silicon Manufacturer & Exporter – Best Price Worldwide
As a Ferro Silicon manufacturer and exporter, we supply high‑quality ferro silicon for global steel and foundry industries with consistent specifications and competitive pricing.
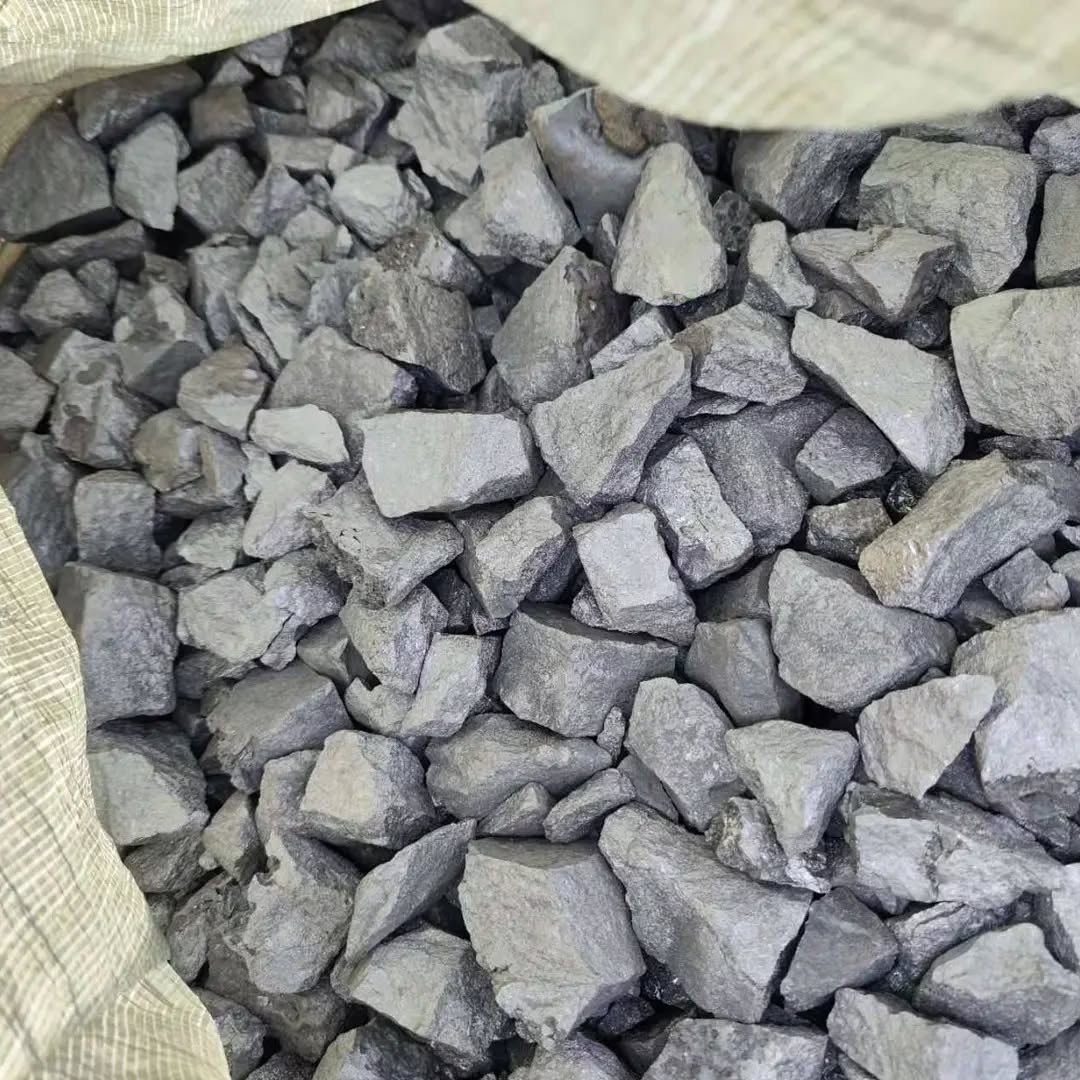
Our products offer Si content from 65% to 75%, low impurities, and flexible sizing for electric arc and induction furnaces.
Through efficient production and export‑focused logistics, we deliver best‑price ferro silicon worldwide with reliable supply across Asia, Europe, the Middle East, and Africa.
We are not a trader, but a direct manufacturer and long‑term supply partner for steel and foundry producers.
")
Ferro Silicon Manufacturing Process:
Ferro Silicon Manufacturing
High‑purity ferro silicon produced with controlled smelting process to ensure stable silicon content and low impurities.
Ferro Silicon Grades
Standard commercial grades with certified chemical composition, suitable for steelmaking and foundry applications.
Ferro Silicon Export Supply
Export‑ready ferro silicon with flexible packaging, particle sizes, and FOB / CFR / CIF delivery terms worldwide.
Ferro Silicon Grades and Chemical Composition:
Ferro Silicon Applications in Steel and Foundry:
")
Export Quality Control and Standards:
Ferro Silicon Packaging and Particle Size:
Ferro Silicon Manufacturer & Exporter
Stable Quality • Competitive Price • Global Supply
We produce export‑grade ferro silicon 65% and 75% with controlled chemistry and consistent performance for steelmaking and foundry industries worldwide.
")
Ferro Silicon Price and Global Market Trends:
| Region | Grade (Si %) | Typical Export Price (USD/MT) | Key Price Drivers |
| China | 75% | 1,350 – 1,550 | Power cost, environmental restrictions, export policy |
| India | 75% | 1,400 – 1,650 | Energy tariffs, domestic steel demand |
| Kazakhstan / Russia | 75% | 1,300 – 1,500 | Energy advantage, logistics, sanctions risk |
| Europe | 75% | 1,550 – 1,850 | Energy cost, limited local production |
| Middle East / Iran | 75% | 1,250 – 1,450 | Competitive energy cost, regional logistics advantage |
| Global Average | 65–75% | 1,350 – 1,600 | Supply-demand balance |
